Distance Time Graph – GCSE Physics
Introduction
- Motion is the change in position of an object with respect to time.
- The three fundamental quantities that describe Motion are:
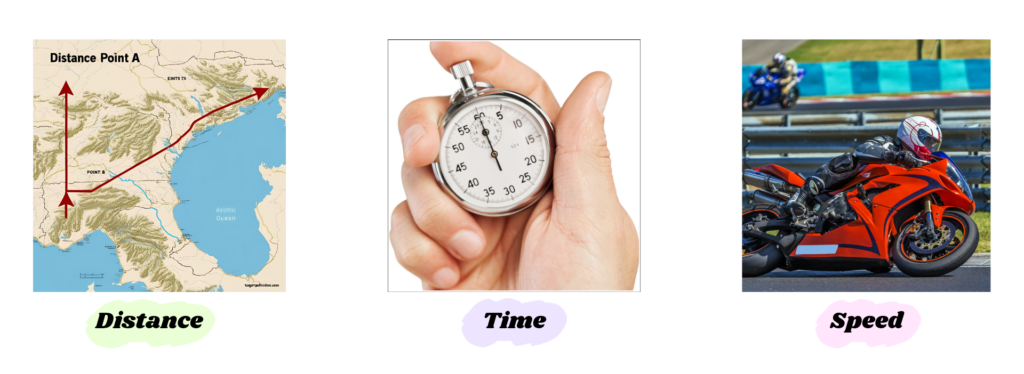
Distance: It is the total path length covered by an object, regardless of direction.
Time: It is the duration over which Motion occurs.
Speed: It tells us how fast an object moves.
What is Speed and How is it Measure?
- Speed is the measure of how fast an object moves.
- It defined as the distance traveled per unit of time.
- It is a Scalar Quantity.
- Speed can be measured using the formula:

Common SI Units:
- Meters per second (m/s)
- Kilometers per hour (km/h)
- Miles per hour (mph)
 Solved Example
Problem: If a bike travels 150 meters in 10 seconds, what’s the speed of bike?
Solution:
Step #1: Given
- Distance: 150 m
- Time Taken: 10s
Step #2: Using the formula:

Step #3: Putting the values and solve:

So, the speed of the bike is 15 meters per second (m/s)
Final Answer: 15 m/s
Speed, Distance and Time Triangle
- The Speed, Distance and Time Triangle is an easy way to remember the relationship between speed, distance, and time.
- It helps in calculating one quantity when the other two are known.
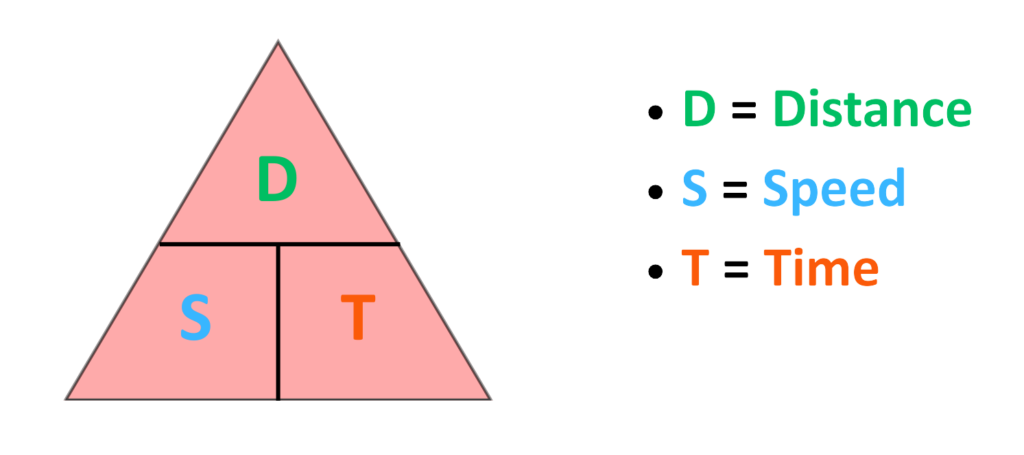
How to use Triangle:
- To Find Speed: Cover “S” and the formula is,

- To Find Distance: Cover “D” and the formula is,

- To Find Time: Cover “T” and the formula is,

What is a Distance-Time Graph?
- A Distance-Time Graph is a graphical representation of how distance changes over time.
- It helps visualize the motion of an object.
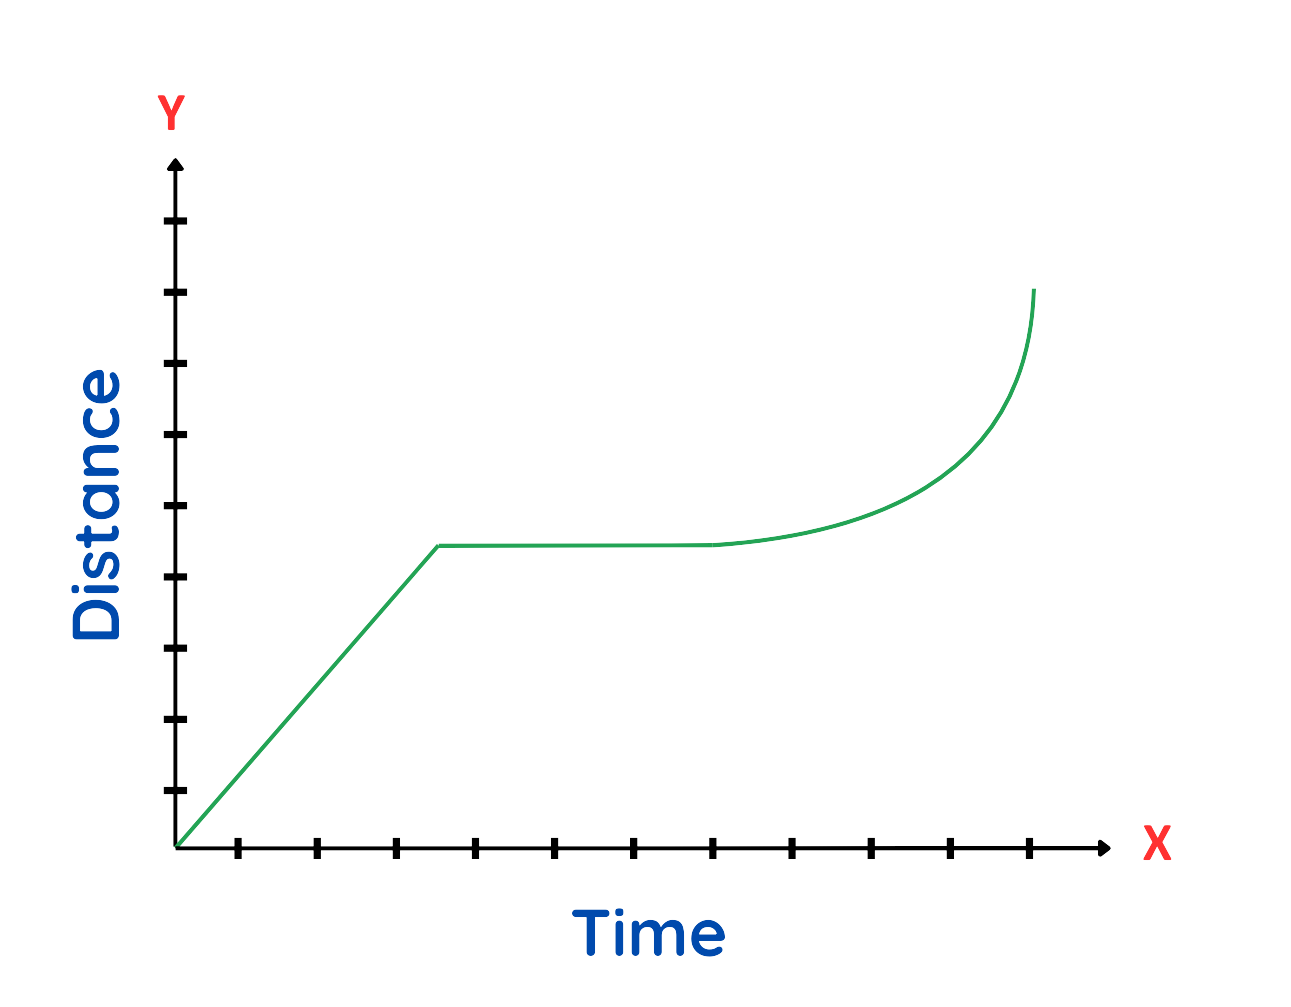
Features of a Distance-Time Graph:
- X-axis (Horizontal) → Represents Time (seconds, minutes, hours).
- Y-axis (Vertical) → Represents Distance (meters, kilometers).
- Slope of the Graph → Represents Speed.
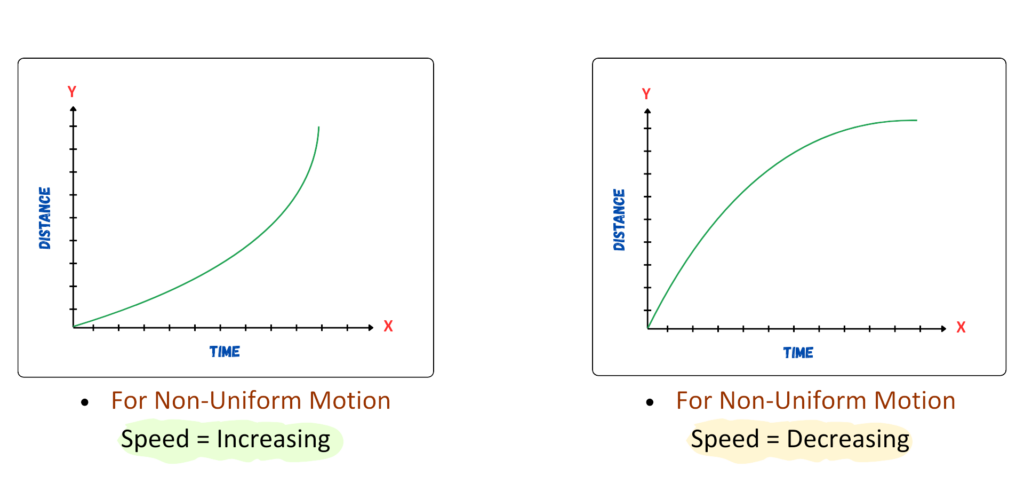
Graphs for various types of body motion:
- In Graph, the Gradient of the line at any point tell us the Speed of the object is travelling.
- Mathematically,


How to Calculate Speed from Distance-Time Graph?
Steps to Calculate Speed from the Graph:
- Step#1: Observe the Graph.
- Step#2: Identify Two Points on the Graph.
- Step#3: Find the Change in Distance (Δd).
- Step#4: Find the Change in Time (Δt).
- Step#5: Calculate the Speed using formula,

Case 1: For Stationary body, it observed that the object is not moving. Since distance remains the same over time,

Case 2: For Uniform body, the graph is a straight line and the speed is constant.
Case 3: For Non-Uniform body, speed varies over time, so find instantaneous speed by calculating the slope of the tangent at a given point.

If Curved upwards → Acceleration (speed increasing).
If Curved downwards → Deceleration (speed decreasing).
 Solved Example
Problem: The distance-time graph of an object shows a slope at 20 meters for 4 seconds. What is the speed of the object?

Solution:
Step #1: Observe the Graph,
- The Body is in Uniform Motion.
Step #2: Identify Two Points on the Graph:
- At t1 = 0s, d1 = 0m.
- At t2 = 4s, d2 = 20m.
Step #3: Change in Distance (Δd):

Step #4: Change in Time (Δt):

Step #5: Calculate the Speed:

Final Answer: 5 m/s
 Solved Example
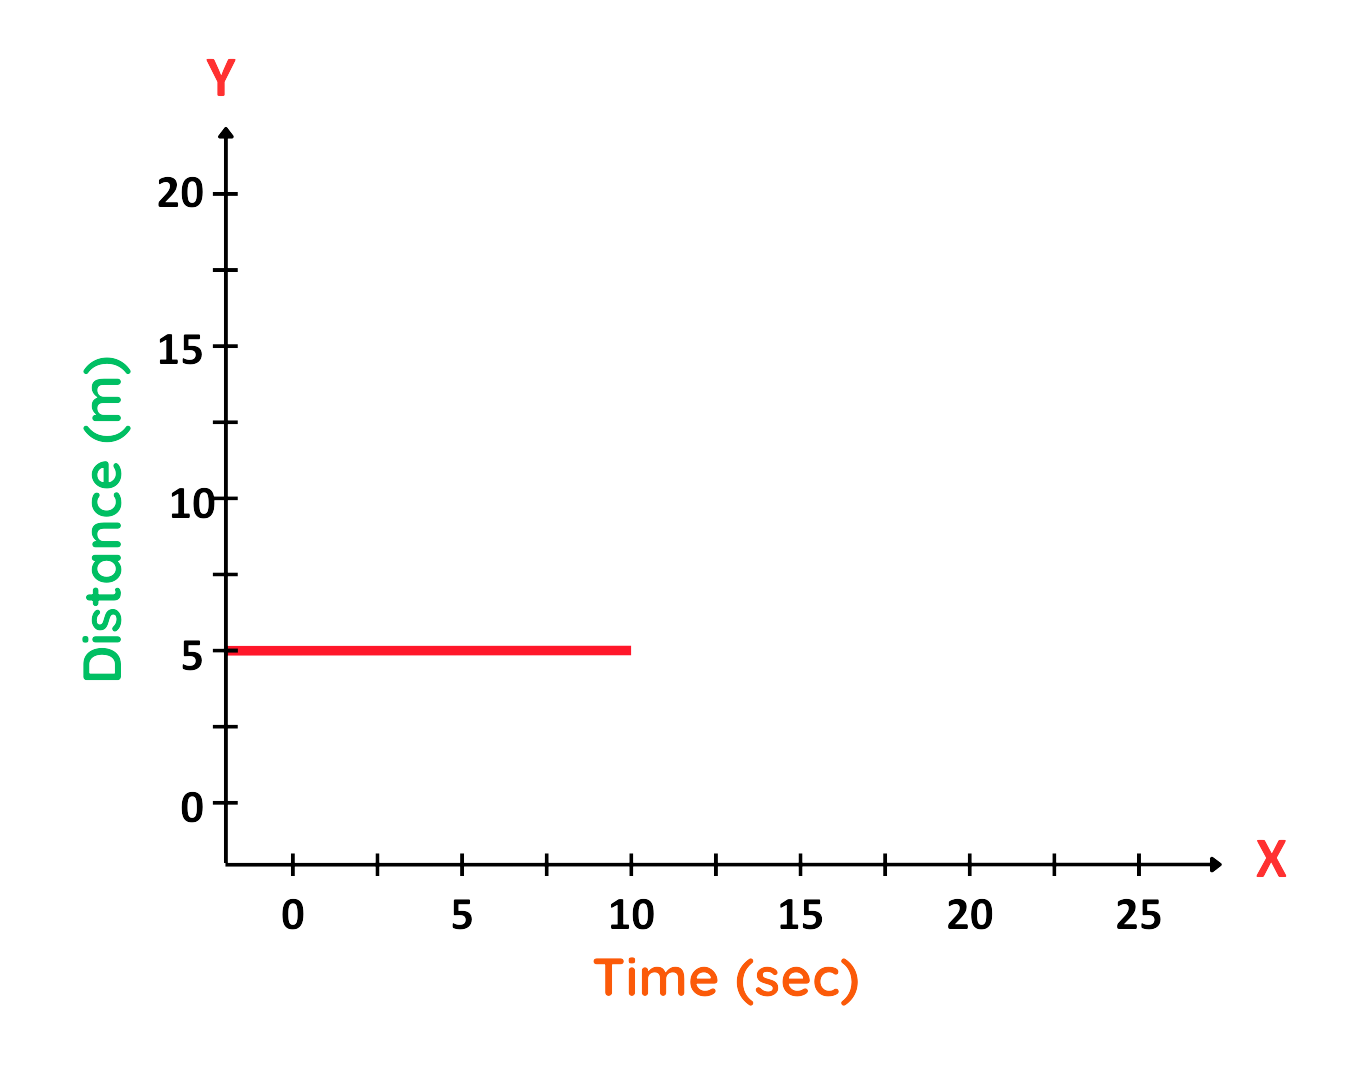
Problem: The Distance-Time Graph of an object shows a flat horizontal line at 5 meters for 10 seconds. What is the speed of the object?
Solution:
Step #1: Observe the Graph,
- The line is horizontal in the graph, so Distance does not change over time.
Step #2: Identify Two Points on the Graph:
- At t1 = 0s, d1 = 5m.
- At t2 = 10s, d2 = 5m.
Step #3: Change in Distance (Δd):

Step #4: Change in Time (Δt):

Step #5: Calculate the Speed:

Final Answer: 0 m/s
Frequently Asked Questions
Solution:
Use the formula: Speed = Distance ÷ Time. On a graph, calculate the slope by dividing the vertical change (distance) by the horizontal change (time).
Solution:
Calculate the area under the graph line. Use basic shapes like rectangles and triangles to measure the area, which gives you the distance.
A steeper line shows a higher speed — the object is moving faster.
Solution:
It means the object is stationary — it is not moving.
Solution:
Yes, when the slope changes or becomes curved (not shown in this example), it indicates acceleration or deceleration.
Practice regularly, look at real exam questions, and use worksheets. Pay attention to axes labels, slope changes, and units.

