Venn Diagram Step-by-Step Examples with Worksheet

Venn Diagram

  • Venn diagrams, graphical tools representing set relationships, are indispensable across disciplines.
  • Employed in mathematics, logic, and statistics, they visually simplify complex relationships.

In this article, we will discuss:

  1. Understanding the Basics of Venn Diagrams
  2. Exploring their significance, components, and practical applications in a variety of domains.

Here is one more link to practice a few extra questions: Maths Genie Venn Diagram Questions

Understanding the Basics of Venn Diagrams

Visual Representation of Sets:

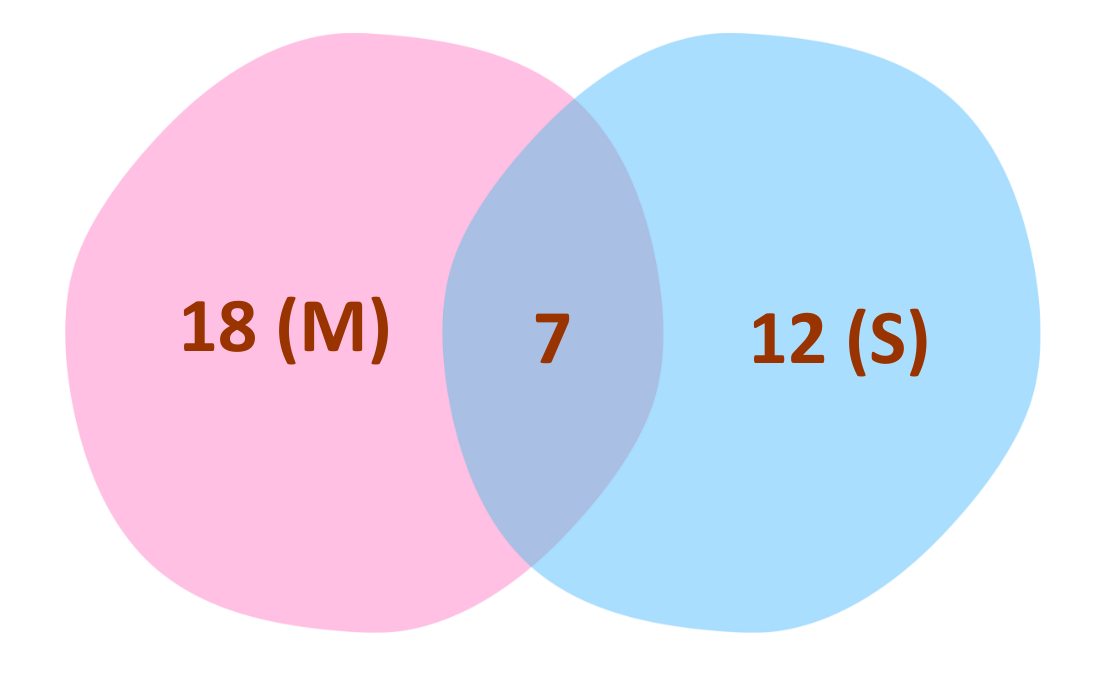
  • Venn diagrams use circles or ellipses to represent sets, offering a visual snapshot of their elements and connections.

Key Elements:

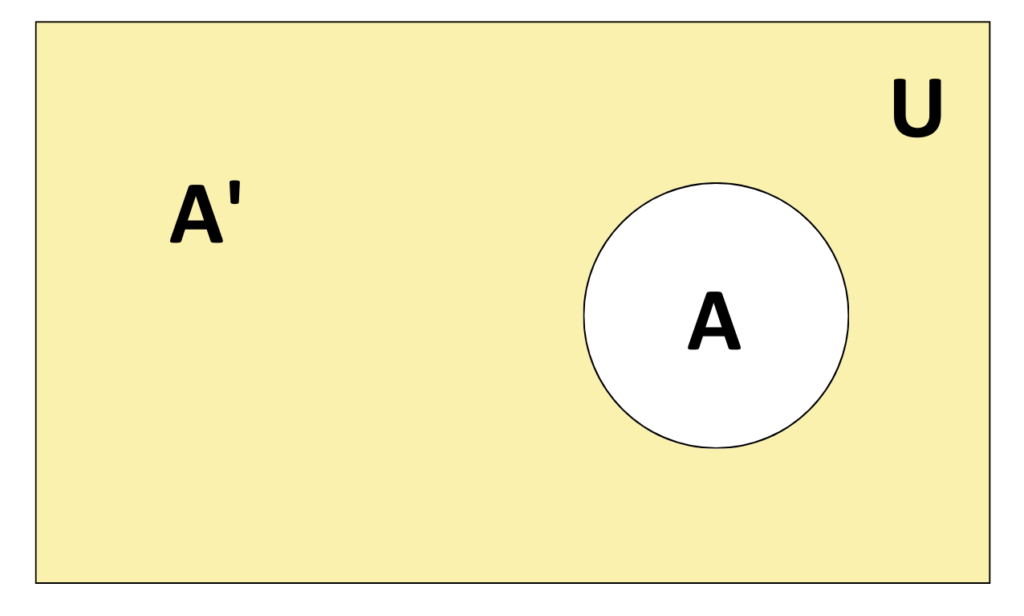
  • Universal Set (U): The entirety of elements under consideration.
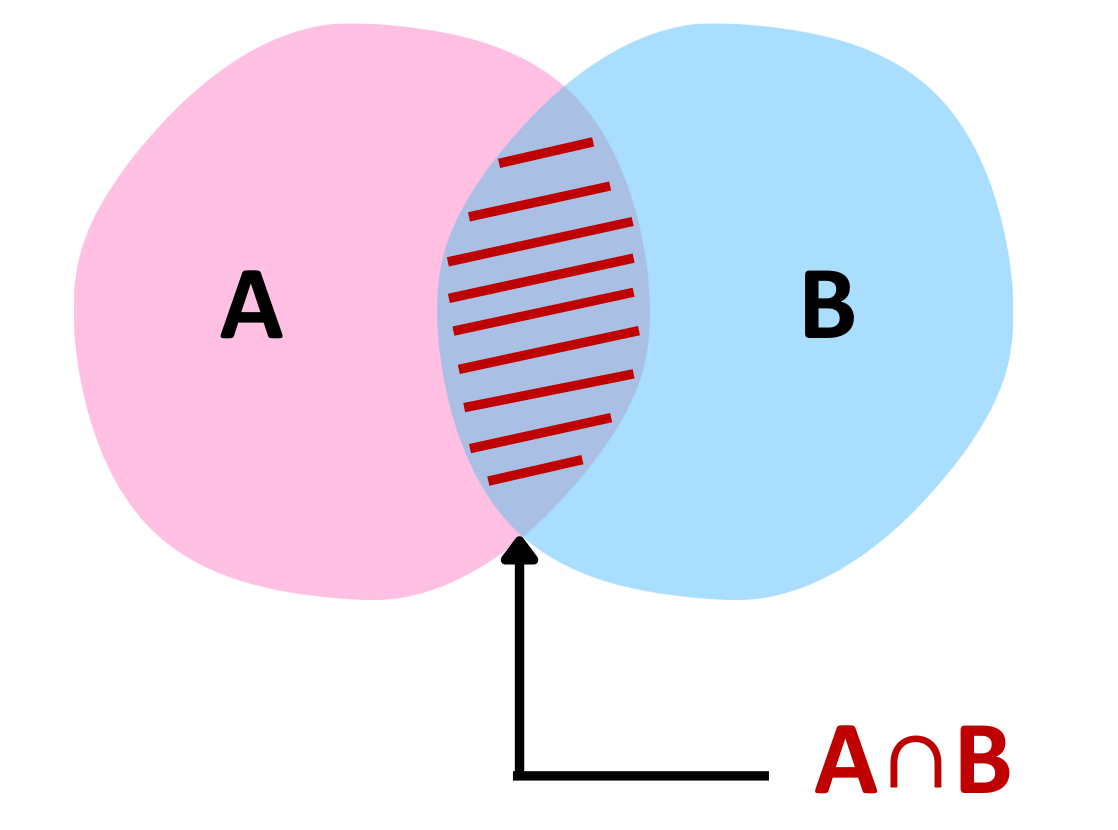
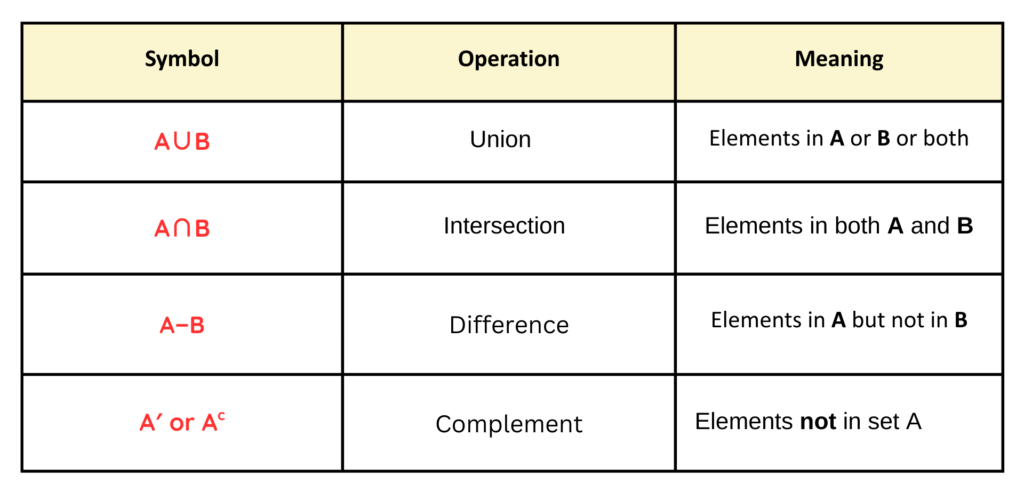
  • Intersections ( A∩B): Overlapping regions, denoting shared elements.
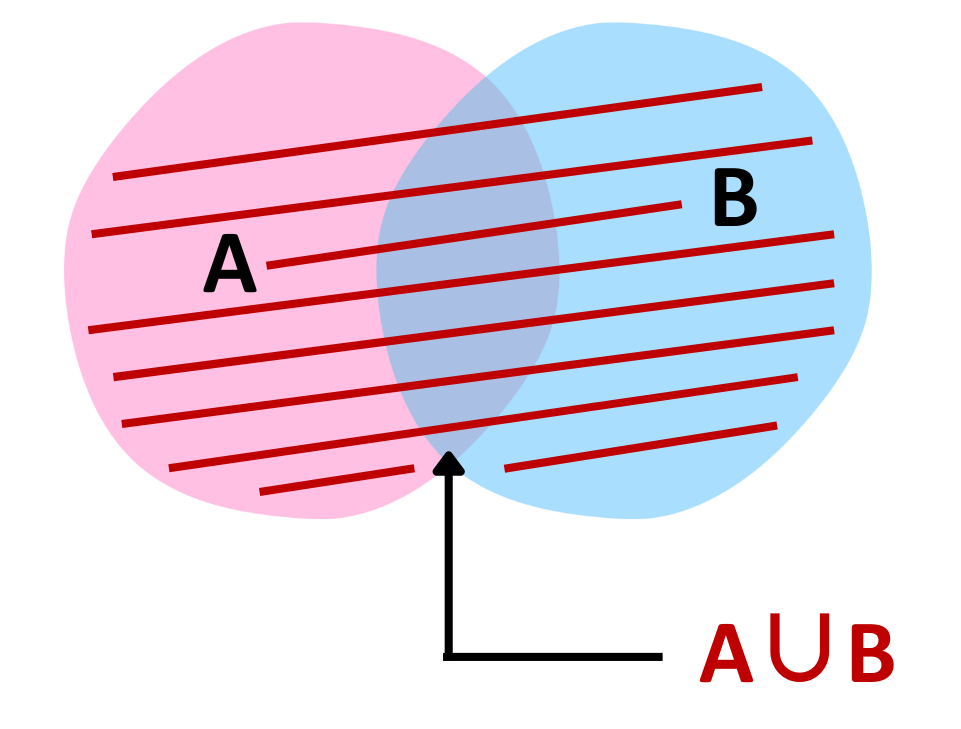
  • Unions (A∪B): Combined elements of both sets, including the overlap.
  • Complements (′A′ and ′B′): Elements outside sets A and B, providing a holistic view.

Steps to Create a Venn Diagram

Step #1: Identify Sets and Universal Set:

  • Define the sets and the universal set that encompasses all elements to establish the context.

Step #2: Draw Circles for Each Set:

  • Physically represent each set with circles, ensuring they visually overlap to showcase relationships.

Step #3: Label Circles:

  • Clearly label each circle to denote the corresponding sets, enhancing clarity.

Step #4: Place Elements:

  • Populate the circles with the elements from their respective sets, emphasizing inclusivity.

Step #5: Identify Relationships:

  • Recognize and highlight the intersection, union, and complement relationships to tell a compelling visual story.

certified Physics and Maths tutor


Solved Example:

Question 1: Consider sets A = {1, 2, 3, 4}, B = {3, 4, 5, 6}, and C = {5, 6, 7, 8}. Visualize the intersection and union of the sets, and also represent the complement of set A.

Solution:

Step #1: Identify the sets A, B, and C and the universal set.

Step #2: Draw three overlapping circles to represent sets A, B, and C.

Draw three overlapping circles to represent sets A, B, and C.

Step #3: Label each circle appropriately.

Step #4: Place elements in the circles, considering their intersections.

Step #5: Highlight the intersection and union relationships.

Step #6: Represent the complement of set A outside its circle.

Venn Diagram Solved Example

Practical Applications of Venn Diagrams

In Mathematics:

  • Aid in understanding set theory, probability, and logic.

In Real-Life Problem Solving:

  • Simplify decision-making and problem-solving by visually representing shared and distinct characteristics.

Conclusion

  • Venn diagrams are indispensable tools for visually simplifying complex relationships across various disciplines.
  • Mastering the creation and interpretation of these diagrams enhances one’s ability to understand and communicate intricate concepts. Whether you’re a student grappling with mathematical relationships or a professional addressing real-world problems, the power of Venn diagrams is a valuable asset in your toolkit.

Practice Questions: Venn Diagram

Question 1: If P and Q are two sets such that the number of elements in P is 24, the number of elements in Q is 22 and the number of elements in both P and Q is 8, find:

(i) n(P ∪ Q)

(ii) n(P – Q)

(iii) n(Q – P)

Question 2: According to the survey made among 200 students, 140 students like Tea, 120 students like lemon juice and 80 like both. What is the total number of students who have a preference for at least one of the drinks?

Question 3: In a group of 500 people, 350 people can speak English, and 400 people can speak Japanese. Find how many people can speak both languages?

Question 4: The following Venn diagram shows games played by the number of students in a class: The following Venn diagram shows games played by the number of students in a class:

venn diagram examples 3 circles

How many students exclusively enjoy cricket or football, without an interest in the other sport?

Question 5: In a class of 40 students, 20 have chosen Mathematics, 15 have chosen mathematics but not physics. If every student has chosen either mathematics or physics or both, find the number of students who chose both mathematics and physics and the number of students who chose physics but not mathematics.

Solutions:

Question 1: If P and Q are two sets such that the number of elements in P is 24, the number of elements in Q is 22 and the number of elements in both P and Q is 8, find:

(i) n(P ∪ Q)

(ii) n(P – Q)

(iii) n(Q – P)

Solution:

Given, n(P) = 24, n(Q) = 22 and n(P ∩ Q) = 8

The Venn diagram for the given information is:

Venn Diagram Worksheet Questions

(i) n(P ∪ Q) = n(P) + n(Q) – n(P ∩ Q)

= 24 + 22 – 8

= 38.

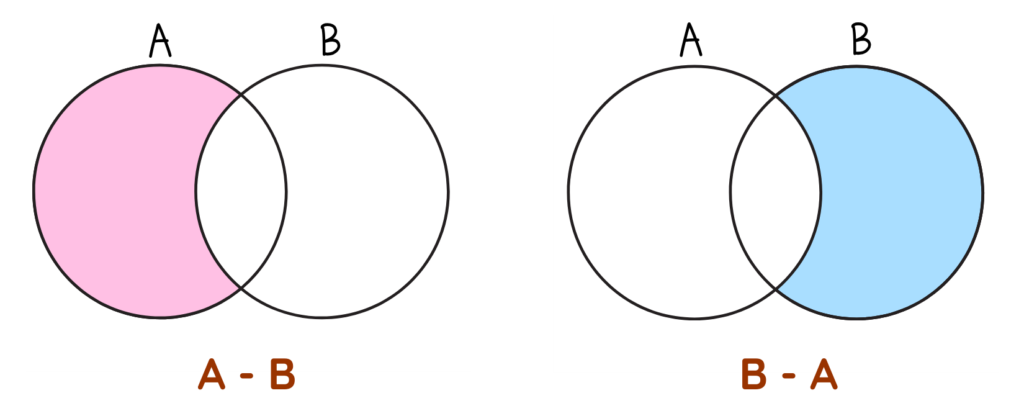
(ii) n(P – Q) = n(P) – n(P ∩ Q)

= 24 – 8

= 16.

(iii) n(Q – P) = n(Q) – n(P ∩ Q)

= 22 – 8

= 14.

Question 2: According to the survey made among 200 students, 140 students like Tea, 120 students like lemon juice and 80 like both. What is the total number of students who have a preference for at least one of the drinks?

Solution:

venn diagram examples

Number of students like Tea = n(P) = 140

Number of students like lemon juice = n(Q) = 120

Number of students like both = n(P ∩ Q) = 80

Number of students like at least one of the drinks = n(P ∪ Q) = n(P) + n(Q) – n(P ∩ Q)

= 140 + 120 – 80

= 180.

Question 3: In a group of 500 people, 350 people can speak English, and 400 people can speak Japanese. Find how many people can speak both languages?

Solution:

Step #1: Let J be the set of people who can speak Japanese and E be the set of people who can speak English. Then,

n(J) = 400

n(E) = 350

n(J ∪ E) = 500

Step #2: We have to find n(J ∩ E).

Now, n(J ∪ E) = n(J) + n(E) – n(J ∩ E)

500 = 400 + 350 – n(J ∩ E)

n(J ∩ E) = 750 – 500

= 250.

∴ 250 people can speak both languages.

Question 4: The following Venn diagram shows games played by the number of students in a class: The following Venn diagram shows games played by the number of students in a class:

venn diagram examples 3 circles

How many students exclusively enjoy cricket or football, without an interest in the other sport?

Solution:

As per the given Venn diagram,

The number of students only like cricket = 7

The number of students only like football = 14

∴ A number of students like only cricket and only football

= 7 + 14

= 21.

Question 5: In a class of 40 students, 20 have chosen Mathematics, 15 have chosen mathematics but not physics. If every student has chosen either mathematics or physics or both, find the number of students who chose both mathematics and physics and the number of students who chose physics but not mathematics.

Solution:

Let, M ≡ Set of students who chose mathematics

P ≡ Set of students who chose Physics

n(M ∪ P) = 40

n(M) = 20

n(P) = n(M ∪ P) – n(M)

n(P) = 40 – 20 = 20

n(M – P) = 15

n(M) = n(M – P) + n(M ∩ P)

20 = 15 + n(M ∩ P)

n(M ∩ P) = 20 – 15

= 5

n(P – M) = n(P) – n(M ∩ P)

n(P – M) = 20 – 5

= 15

Practice Question 2 Circles Diagram