Velocity-Time Graphs Step-by-Step Examples with Worksheet
Velocity-Time Graphs
- Velocity-time graphs are graphical representations of an object’s velocity as it moves over time.
- These graphs are incredibly useful tools for analysing and understanding the motion of objects, particularly in physics and engineering.
In this article, we will discuss:
- Using Velocity-Time Graphs to Find Acceleration
- Using Velocity-Time Graphs to Find Total Distance
Here is one more link to practice a few extra questions: Maths Genie Velocity-Time Graphs Questions
Velocity-Time Graphs: An Overview
- A velocity-time graph plots an object’s velocity on the y-axis against time on the x-axis.
- Velocity is the rate at which an object changes its position, so the slope of the graph represents the object’s acceleration.
- The x-axis represents time, and the y-axis represents velocity.
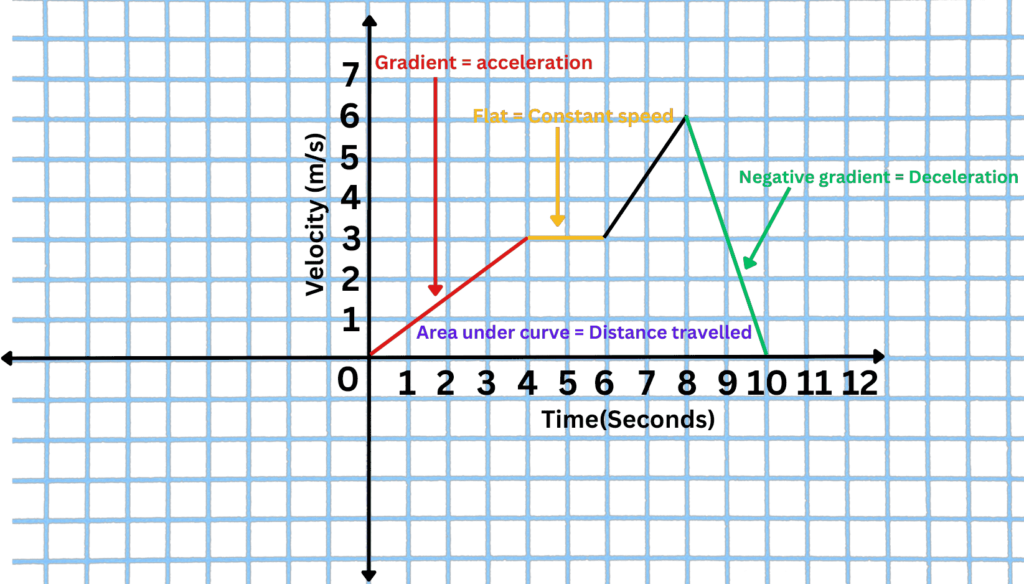
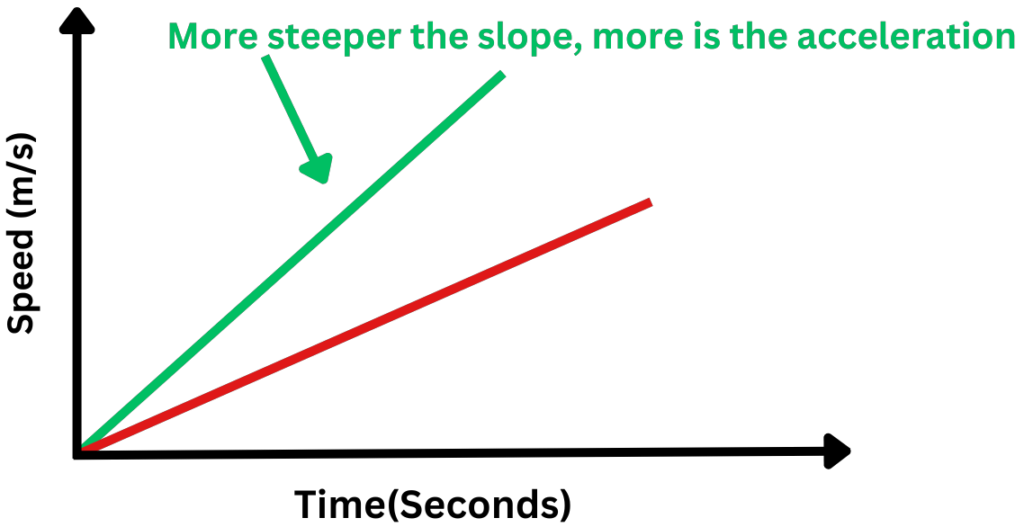
- The slope of the line at any given point on the graph gives the acceleration of the object at that moment. The steeper the slope, the greater the acceleration. If the slope is negative, then the object is decelerating or slowing down.
- The area under the graph represents the distance travelled by the object.
Using Velocity-Time Graphs to Find Acceleration
- The gradient of the line represents the acceleration of the object. Acceleration is the rate at which an object changes its velocity over time.
- To find the acceleration of an object, calculate the slope of the velocity-time graph at any given point.
- A positive slope indicates an increasing velocity or acceleration, while a negative slope indicates a decreasing velocity or deceleration.
- A flat section of the graph indicates constant velocity, but not necessarily that the object has stopped moving.
Solved Example: Velocity-Time Graphs
Let’s say a ball is thrown upwards from a height of 10 meters with an initial velocity of 20 m/s. The velocity-time graph for this motion would look like:
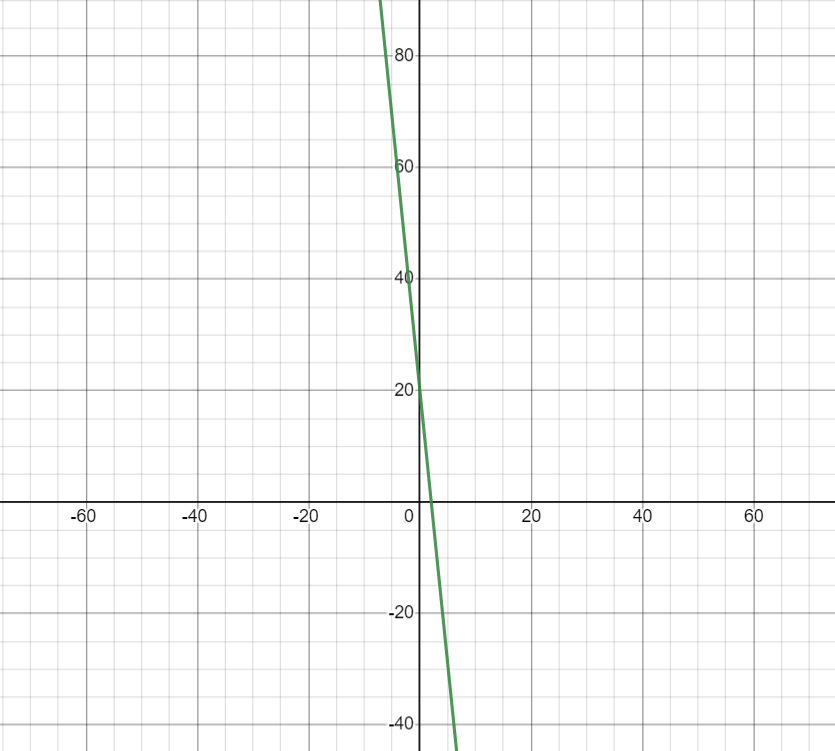
- Using this graph, we can find the acceleration of the ball at any point.
- We know that the gradient of the line represents acceleration, so we can find the acceleration of the ball when it is at its maximum height by finding the gradient of the line at that point.
- The gradient of the line is:
Acceleration = Rise/Run
= (0 – 20)/(2 – 0)
= -10 m/s²
- Therefore, the acceleration of the ball at its maximum height is -5 m/s², which approximately represents the acceleration due to gravity.
Practice Questions
Question 1: Shown below are speed-time graphs for some journeys. Calculate the total distance travelled. 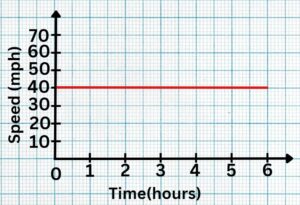
Solution: 240 miles
Question 2: Shown below are speed-time graphs for some journeys. Calculate the total distance travelled. 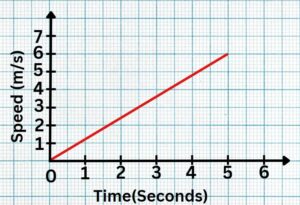
Solution:15 meters
Using Velocity-Time Graphs to Find Total Distance
- The area under the graph represents the distance travelled by the object. To find the total distance travelled, simply find the area under the curve on the graph.
- This can be done by dividing the graph into smaller segments and finding the area of each segment separately. Then, add up the areas to get the total distance travelled.
- This method works well for simple graphs, but for more complex graphs, integration may be necessary.
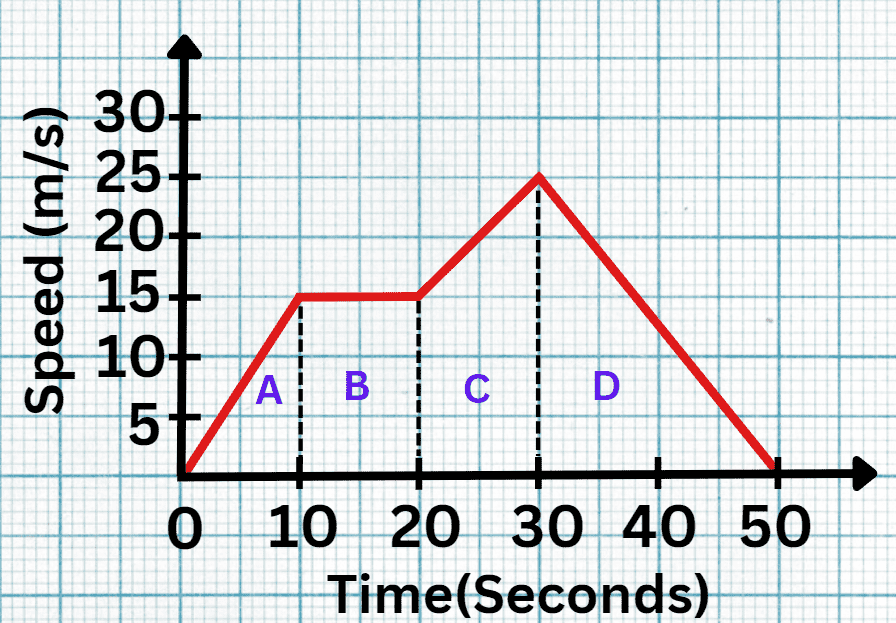
Solved Example:
Question 1: How do you calculate the total distance travelled over a 100-second car journey using a speed-time graph, given that the area under the graph represents the distance travelled?
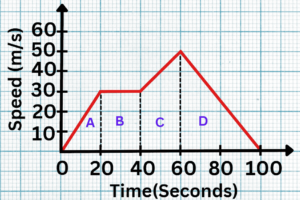
Solution:
- Step #1: Identify Shapes
Break down the area under the speed-time graph into four distinct shapes: A, B, C, and D.
- Step #2: Calculate Areas
When lines are parallel, they share the same gradient. This means that their slopes are equal.
A = ½ x 20 x 30 = 300
B = 20 x 30 = 600
C = ½ (30 +50) x 20 = 800
D = ½ x 40 x 50 = 1000
- Step #3: Sum of Areas
Add up the calculated areas to find the total distance travelled:
300 + 600 + 800 + 1000 = 2700 meters.
Therefore, the total distance travelled over the 100 seconds is 2700 meters, obtained by summing the areas of the identified shapes (A, B, C, and D) under the speed-time graph.
Practice Questions
Question 1: Shown below are speed-time graphs for some journeys. Calculate the total distance travelled. 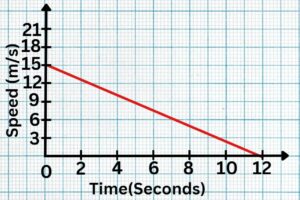
Solution: 90 meters
Question 2: Shown below are speed-time graphs for some journeys. Calculate the total distance travelled. 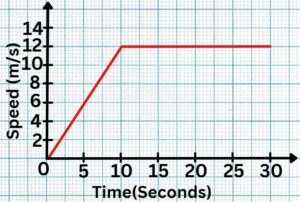
Solution: 300 meters
Conclusion
- Velocity-time graphs provide valuable insights into the motion of objects.
- The gradient (slope) of the line on a velocity-time graph reveals information about acceleration or deceleration.
- Analyzing the area under the graph helps determine the total distance travelled by the object.
- The shape of the curve on the graph can indicate various aspects of an object’s motion.
- Velocity-time graphs enable the identification of acceleration, deceleration, and total distance travelled.
- These graphs are a crucial tool for studying and understanding object motion.
Practice Questions
Question 1: Shown below are speed-time graphs for some journeys. Calculate the total distance travelled. 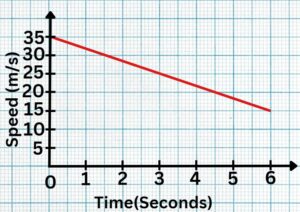
Solution: 150 meters
Question 2: Shown below are speed-time graphs for some journeys. Calculate the total distance travelled. 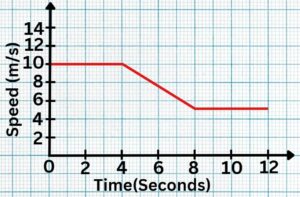
Solution: 90 meters
Worksheet on Velocity-Time Graphs
Question 1: A bus travels along a straight road for 600 m. It travels at a constant velocity for the whole journey, which takes 90 s. Sketch the displacement-time graph. What was the velocity of the bus?
Question 2: Below is the sketch of a speed-time graph for a cyclist moving on a straight road for 7 seconds. 
Question 3: A sprinter runs a race of 200 m. His total time for running the race is 20.32 s. Below is a sketch of the speed-time graph for the motion of the sprinter. 
Question 4: Here is a speed-time graph for a train journey between 2 stations 

