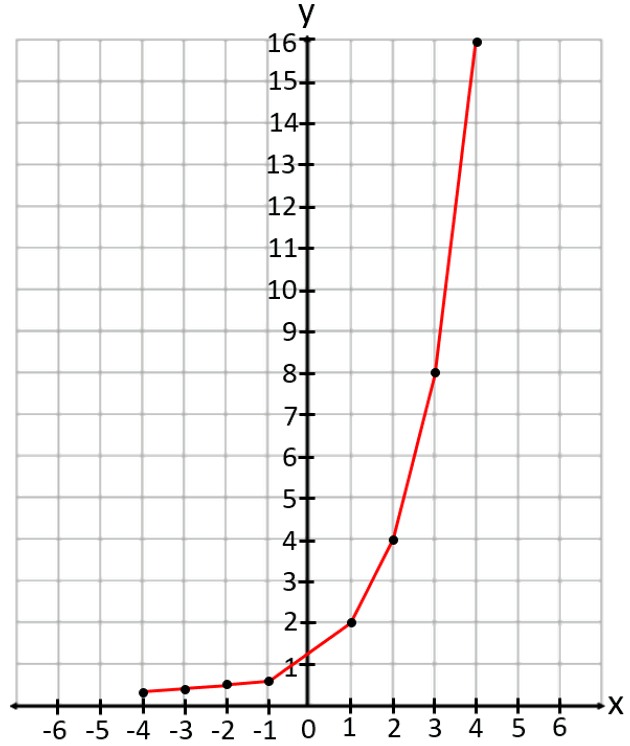
Trigonometric and Exponential Graphs with Worksheet
Trigonometric and Exponential Graphs
- In mathematics, graphs are a visual representation of a function or relationship between two variables.
- Trigonometric and exponential functions are two important types of functions in mathematics that are commonly plotted on graphs.
In this article, we will discuss:
- What are Trigonometric Ratios?
- What is an Exponent?
- Steps for plotting Trigonometric Graphs (Sine, Cosine, Tan) and Exponential Graphs
Here is one more link to practice a few extra questions: Maths Genie Trigonometric and Exponential Graphs Questions
What are Trigonometric Ratios?
- Trigonometric ratios are ratios that relate the sides of a right triangle to its angles.
- The three main trigonometric ratios are sine, cosine, and tangent, commonly abbreviated as sin, cos, and tan, respectively.
- These ratios are used in many applications, such as finding the height of a building, the distance between two points, and the angle of a slope.
Steps for plotting Trigonometric Graphs (Sine, Cosine, Tan)
- To plot a trigonometric graph, we need to first understand the shape of the function.
- The sine and cosine functions are periodic functions that oscillate between 1 and -1.
- The tangent function has asymptotes at regular intervals.
Here are the steps to plot a trigonometric graph:
- Step #1: Determine the period of the function by dividing 2π by the coefficient of x.
- Step #2: Determine the amplitude of the function, which is the maximum value of the function.
- Step #3: Determine the phase shift of the function, which is the horizontal displacement of the function from its original position.
- Step #4: Plot the graph by plotting key points using the period, amplitude, and phase shift.
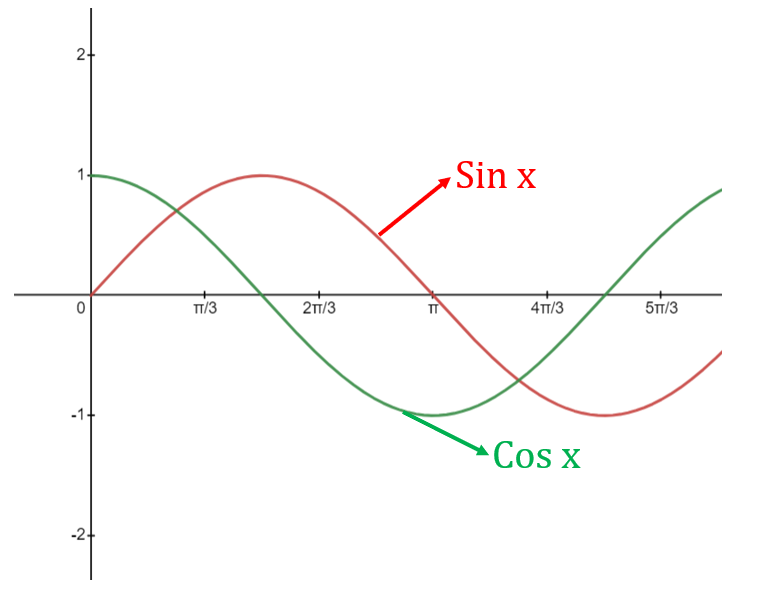
Solved Example:
Question 1: y = 3sin(2x)
Solution:
- Step #1: The period of the function is 2π/2 = π.
- Step #2: The amplitude of the function is 3.
- Step #3: There is no phase shift in this function.
- Step #4: To plot the graph, we can start by finding the key points for one period of the function.
- The maximum value of the function is 3 and occurs at π/2 and 3π/2.
- The minimum value of the function is -3 and occurs at π and 2π.
- We can then use these key points to sketch the graph
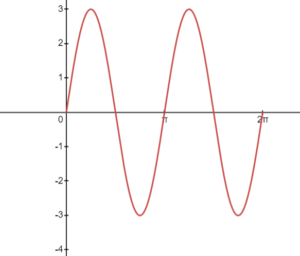
Question 2: y = 2cos (3x – π/4)
Solution:
- Step #1: The period of the function is 2π/3.
- Step #2: The amplitude of the function is 2.
- Step #3: The phase shift of the function is π/12 units to the right.
- Step #4: To plot the graph, we can find the key points for one period of the function.
- The maximum value of the function is 2 and occurs at π/3 and 5π/3.
- The minimum value of the function is -2 and occurs at 2π/3 and 4π/3.
- We can then shift the graph π/12 units to the right and sketch the graph
What is an Exponent?
- An exponent is a mathematical notation that indicates how many times a number, called the base, should be multiplied by itself.
- For example, 23 means 2 multiplied by itself 3 times, or 2 x 2 x 2 = 8.
- Exponents are used in many mathematical formulas, such as the compound interest formula and the formula for exponential growth.
Steps for plotting Exponential Graphs
- To plot an exponential graph, we need to first understand the shape of the function.
- An exponential function has a curve that starts at a certain point and either increases or decreases rapidly.
Here are the steps to plot an exponential graph:
- Step #1: Determine the base of the function, which is the number that is being raised to power.
- Step #2: Determine the y-intercept of the function, which is the value of the function when x = 0.
- Step #3: Determine whether the function is increasing or decreasing by checking the sign of the base.
- Step #4: Plot the graph by plotting key points using the base and y-intercept.
Solved Example
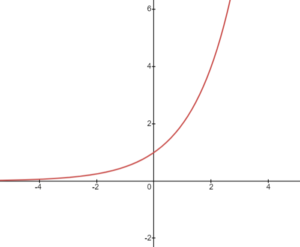
Question 1: y = 2x
Solution:
- Base = 2
- Y-intercept = 1
- Increasing function
To plot this graph, we can choose some key points:
- When x = 0, y = 1
- When x = 1, y = 2
- When x = -1, y = 1/2
By plotting these points on a graph and connecting them, we obtain a rising exponential curve that asymptotically approaches the x-axis without intersecting it.
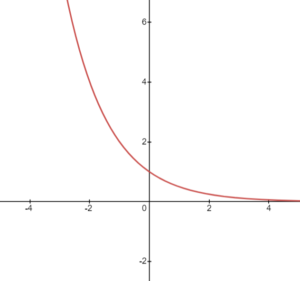
Question 2: y = 0.5x
Solution:
- Base = 0.5
- Y-intercept = 1
- Decreasing function
To plot this graph, we can choose some key points:
- When x = 0, y = 1
- When x = 1, y = 0.5
- When x = -1, y = 2
By plotting these points on a graph and connecting them, we obtain a rising exponential curve that asymptotically approaches the x-axis without intersecting it.
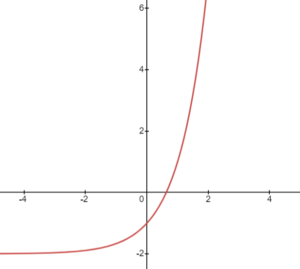
Question 3: y = 3x – 2
Solution:
- Base = 3
- Y-intercept = -1
- Increasing function
To plot this graph, we can choose some key points:
- When x = 0, y = 2
- When x = 1, y = 3
- When x = -1, y = 1/3
Plotting these points on a graph and connecting them, we get an increasing exponential curve that intersects the y-axis at -1.
Conclusion
- Trigonometric and exponential graphs provide valuable insights into mathematical functions and relationships, making them indispensable tools for comprehension.
- By grasping the shape and characteristics of these graphs, we gain the ability to solve a multitude of real-world problems in diverse fields including engineering, physics, and economics.
- These graphs offer a visual representation of complex mathematical concepts, enabling us to analyze and interpret data with greater clarity and precision.
- The understanding of trigonometric and exponential graphs equips us with practical problem-solving skills, empowering us to apply mathematical principles to real-life scenarios.
- Incorporating trigonometric and exponential graphs into our toolkit expands our capacity to innovate, optimize processes, and make informed decisions in various professional domains.
Practice Questions: Trigonometric and Exponential Graphs
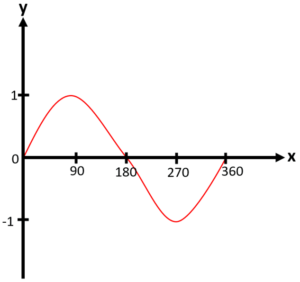
Question 1: Sketch the graph of y = sin x° for 0 ≤ x ≤ 360
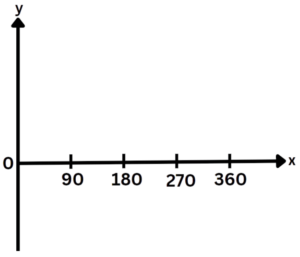
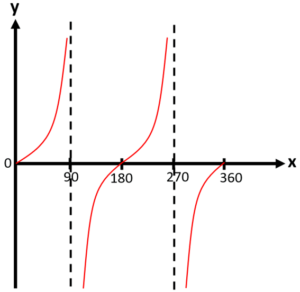
Question 2: Sketch the graph of y = tan x° for 0 ≤ x ≤ 360

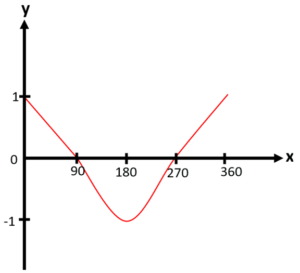
Question 3: Sketch the graph of y = cos x° for 0 ≤ x ≤ 360

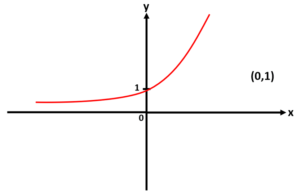
Question 4: On the grid, sketch the curve with the equation y = 2x. Give the coordinates of any points of intersection with the axes

Question 5:
(a) Complete the table of values for y = 3x

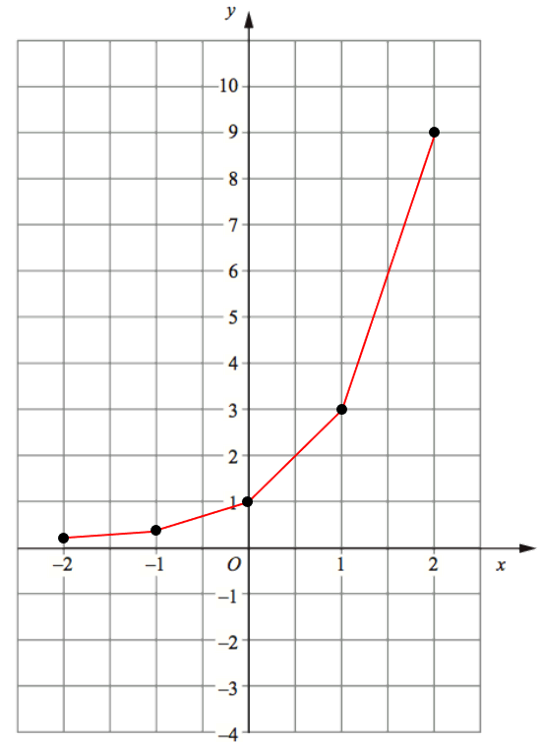
(b) Draw the graph of y = 3x for values of x from -2 to 2
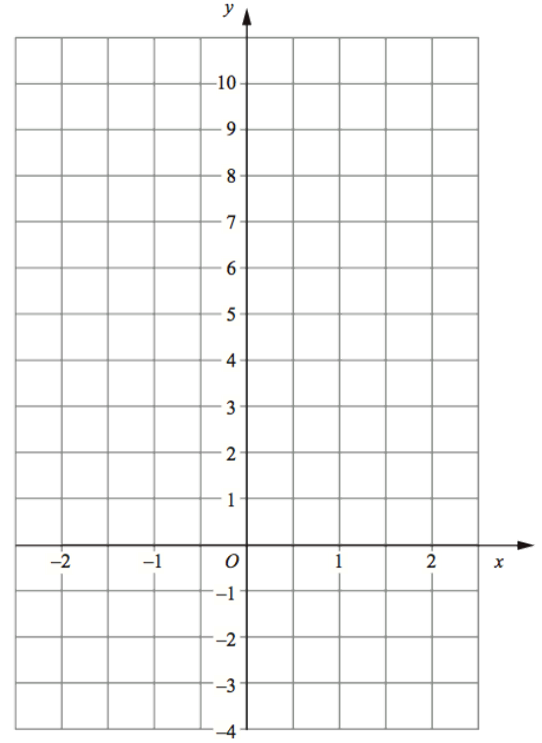
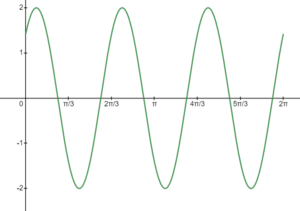
Question 6: Draw the graph of y = 2x for values of x from -4 to 4
Solutions:




Question 5:
(a) Complete the table of values for y = 3x

(b) Draw the graph of y = 3x for values of x from -2 to 2

Solution:
(a)

(b)
Question 6: Draw the graph of y = 2x for values of x from -4 to 4.

Solution:

