Probability Tree Diagram: Examples with Worksheet
Probability Tree Diagram
- Probability is the main part of mathematics, which provides a way to deal with the events that have some uncertainty systematically.
- Probability tree diagrams are the ones that give the visual representation that calculates probabilities in sequential events easily.
- What are Probability Tree Diagrams?
- How to Use a Tree Diagram to Find Probability
What are Probability Tree Diagrams?
- Probability tree diagrams are the graphical tools that are used to show the potential outcomes of a series of events and their probabilities.
- They are a well-organized and easy-to-understand visual representation of complicated probability situations.
- For using a probability tree diagram, we have to know the probability of each event at first.
- The probabilities on all the branches in each branch always sum up to 1.
- Starting from, you have to explain the possible outcomes for the first event which will be at the ends of the branches.
- Write the probabilities along the branches.
- Probabilities can be written either as fractions or as decimals.
Example:
Think of a situation where you throw a fair coin twice. The tree diagram would have two branches for each flip, which would show the possible outcomes (Heads or Tails) at each stage.
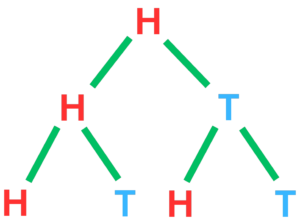
Every branch in the tree is an example of a sequence of outcomes, and the probability of each branch is the product of the probabilities in that sequence.
How to Use a Tree Diagram to Find Probability
To begin with, it is important to specify the events that are to be analyzed and the order in which they take place.
Construct the Tree Diagram:
- For every event, you will create branches that will show the possible outcomes.
- Assign the probability of each branch according to the probability of the corresponding outcome.
- The probabilities are multiplied along each branch to determine the probability of the entire sequence of events.
Common Misconceptions
Cancelling Fractions:
- Do not cancel the fractions too early; the information about the event is in the numerator and the denominator.
Multiplying Decimals:
- Beware of the multiplying of decimals in order to avoid mistakes.
Dependent Events Reminder:
Independent events, the probability of the second event is changed by the outcome of the first event.
Solved Example:
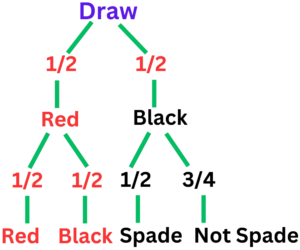
Question 1: Think of the situation where you draw a card from a normal deck of 52 cards, put it back and then draw a second card. Make a probability tree diagram and find the probability of drawing a red card and then drawing a spade.
Solution:
- Step #1: Describe the Events
Event A: The first card drawn is a red one.
Event B: Presenting a spade on the second draw.
- Step #2: Create the Tree Diagram
Create branches for each of the possible results of the first and second draws.
Give every branch a probability.
- Step #3: Calculate Probabilities
The probability of drawing a red card and then drawing a spade is the product of the probabilities along the path:
1/2 x 1/4 = 1/8
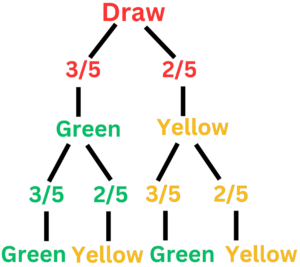
Question 2: Think of a box having three green balls and two yellow balls. A ball is drawn, its colour is recorded and then it is replaced again. A second ball is selected. Make a probability tree diagram and find the probability of drawing two green balls.
Solution:
- Step #1: Describe the Events
Event G: The first ball is drawn and it is a green ball.
Event Y: Drawing a yellow ball on the first draw.
Event GG: Drawing a green ball on the second draw.
- Step #2: Create the Tree Diagram
Create branches for each of the possible results of the first and second draws.
Give every branch a probability
- Step #3: Calculate Probabilities
The probability of drawing two green balls is the product of the probabilities along the path GG:
3/5 x 3/5 = 9/25
Conclusion
- Probability tree diagrams give a systematic and correct way of dealing with the uncertainties in sequential events.
- They are the perfect tools for visual representation and systematic organization of data concerning the possible results.
- These diagrams are considered the most important instrument in probability theory, and they help to analyze and predict the outcomes even in different circumstances.
Worksheet on Probability Trees
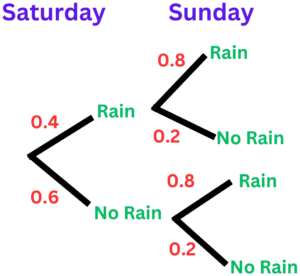
Question 1: The probability that it will rain on Saturday is 0.4
The probability that it will rain on Sunday is 0.8
The probability tree diagram shows this information.
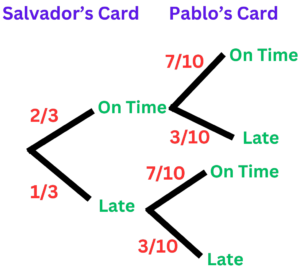
Question 2: Calculate the probability that both birthday cards, one sent to Salvador and the other to Pablo, arrive on time according to the given probability tree.
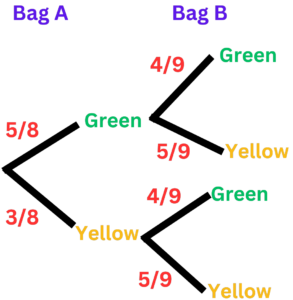
Question 3: Hina has two bags of counters, Bag A and Bag B.
There are 5 green counters and 3 yellow counters in bag A.
There are 4 green counters and 5 yellow counters in bag B.
Hina takes at random a counter from each bag.
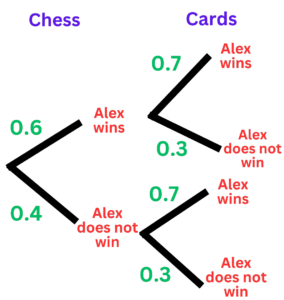
Question 4: Alex is going to play one game of Chess and one game of Cards.
The probability she will win the game of chess is 0.6
The probability she will win the game of Cards is 0.7.
